Does Primary Reform Actually Produce More Deal-Makers? A Direct Test.
I’ve written before that the case for all-party primary reform as a moderation device is empirically weak. Across the four cases currently on the books (top-two in California and Washington, jungle in Louisiana, top-four in Alaska), the published political science finds no reliable effect of primary type on the ideological positioning of the members who get elected.
But the strongest version of the reform argument was never really about moderation. A sharper alternative hypothesis makes two distinct claims:
-
All-party primaries produce legislators more willing to make deals across party lines, whatever their ideology. The mechanism is about governing incentives, not ideological positioning. A top-two winner might still be a progressive or a conservative, but the incentive structure of having to assemble a general-election coalition beyond one’s own party makes that winner behave more cooperatively once in office.
-
All-party primaries produce a wider range of candidates within each party. Under closed primaries, ideological gatekeepers narrow the field. Under all-party systems, both moderate and strongly ideological factions can survive to the general election, so reform-state delegations should contain a broader spectrum of within-party types, including brokers who can reach across the aisle.
Both claims are testable. Dealmaking is behavior. Heterogeneity is a measurable property of a delegation. This post runs both tests on congressional data from the 113th through 118th Congresses (2013–2023).
Key findings
-
Reform states do not elect more bipartisan members of Congress. In the House, California and Washington rank 26th and 22nd of 50 on delegation BPI, middle-of-the-pack and nearly indistinguishable from the national median despite more than a decade under top-two. Louisiana ranks 47th after fifty years of the jungle primary. The Senate picture is similar: CA and WA sit in the bottom 10. Alaska ranks 5th but held that position before the 2022 top-four reform.
-
The regression reinforces the null. With full controls (ideology, state partisan balance, party, seniority, committee roles, Congress fixed effects), the House top-two coefficient is +0.02 (p > 0.1) and the Senate top-two is −0.23 (p > 0.1), both indistinguishable from zero. The jungle-primary coefficient is significantly negative in the House. Reform is not what predicts bipartisan cosponsorship; ideological moderation and state competitiveness are.
-
California’s congressional delegation did not become more ideologically diverse after top-two. Its Democratic delegation became slightly more homogeneous (mean within-party SD fell from 0.124 to 0.116). CA ranked middle-of-the-pack on congressional heterogeneity both before and after the reform.
-
California’s state legislature did become more internally diverse after 2011, but the attribution is unclear. Top-two and independent redistricting both took effect in the same cycle. Either or both could explain the shift. The effect is also modest (about a 30 percent increase in within-party SD), and California remains one of the most between-party-polarized state legislatures in the country. Whatever is happening in Sacramento has not traveled to Washington.
-
State competitiveness explains delegation heterogeneity better than primary system does. After controlling for state size, partisan balance, and Congress fixed effects, reform dummies add essentially nothing.
What the Bipartisan Index measures
Since 2014, the Lugar Center and Georgetown’s McCourt School of Public Policy have published a Bipartisan Index (BPI) for every member of Congress. The score counts how often a member co-sponsors bills introduced by the opposite party, and how often their own bills attract co-sponsors from across the aisle. Higher scores mean more cross-party collaboration. It is not ideology. It is not party-line voting. It is the coalition-building behavior reform advocates say all-party primaries should encourage. I pulled BPI for every senator and representative in the 113th through 118th Congresses (2013 through 2023), about 3,000 member-year observations.
The four all-party primary states over this window are California (top-two, first used 2012), Washington (top-two, first used 2008), Louisiana (jungle primary, first used 1975 for federal offices), and Alaska (top-four, first used 2022; only one Congress of post-reform data is available).
Test 1 — Dealmaking: where do the reform states rank?
If reform produces more cross-partisan dealmakers, the four reform states should cluster at the top of the BPI distribution. They don’t.
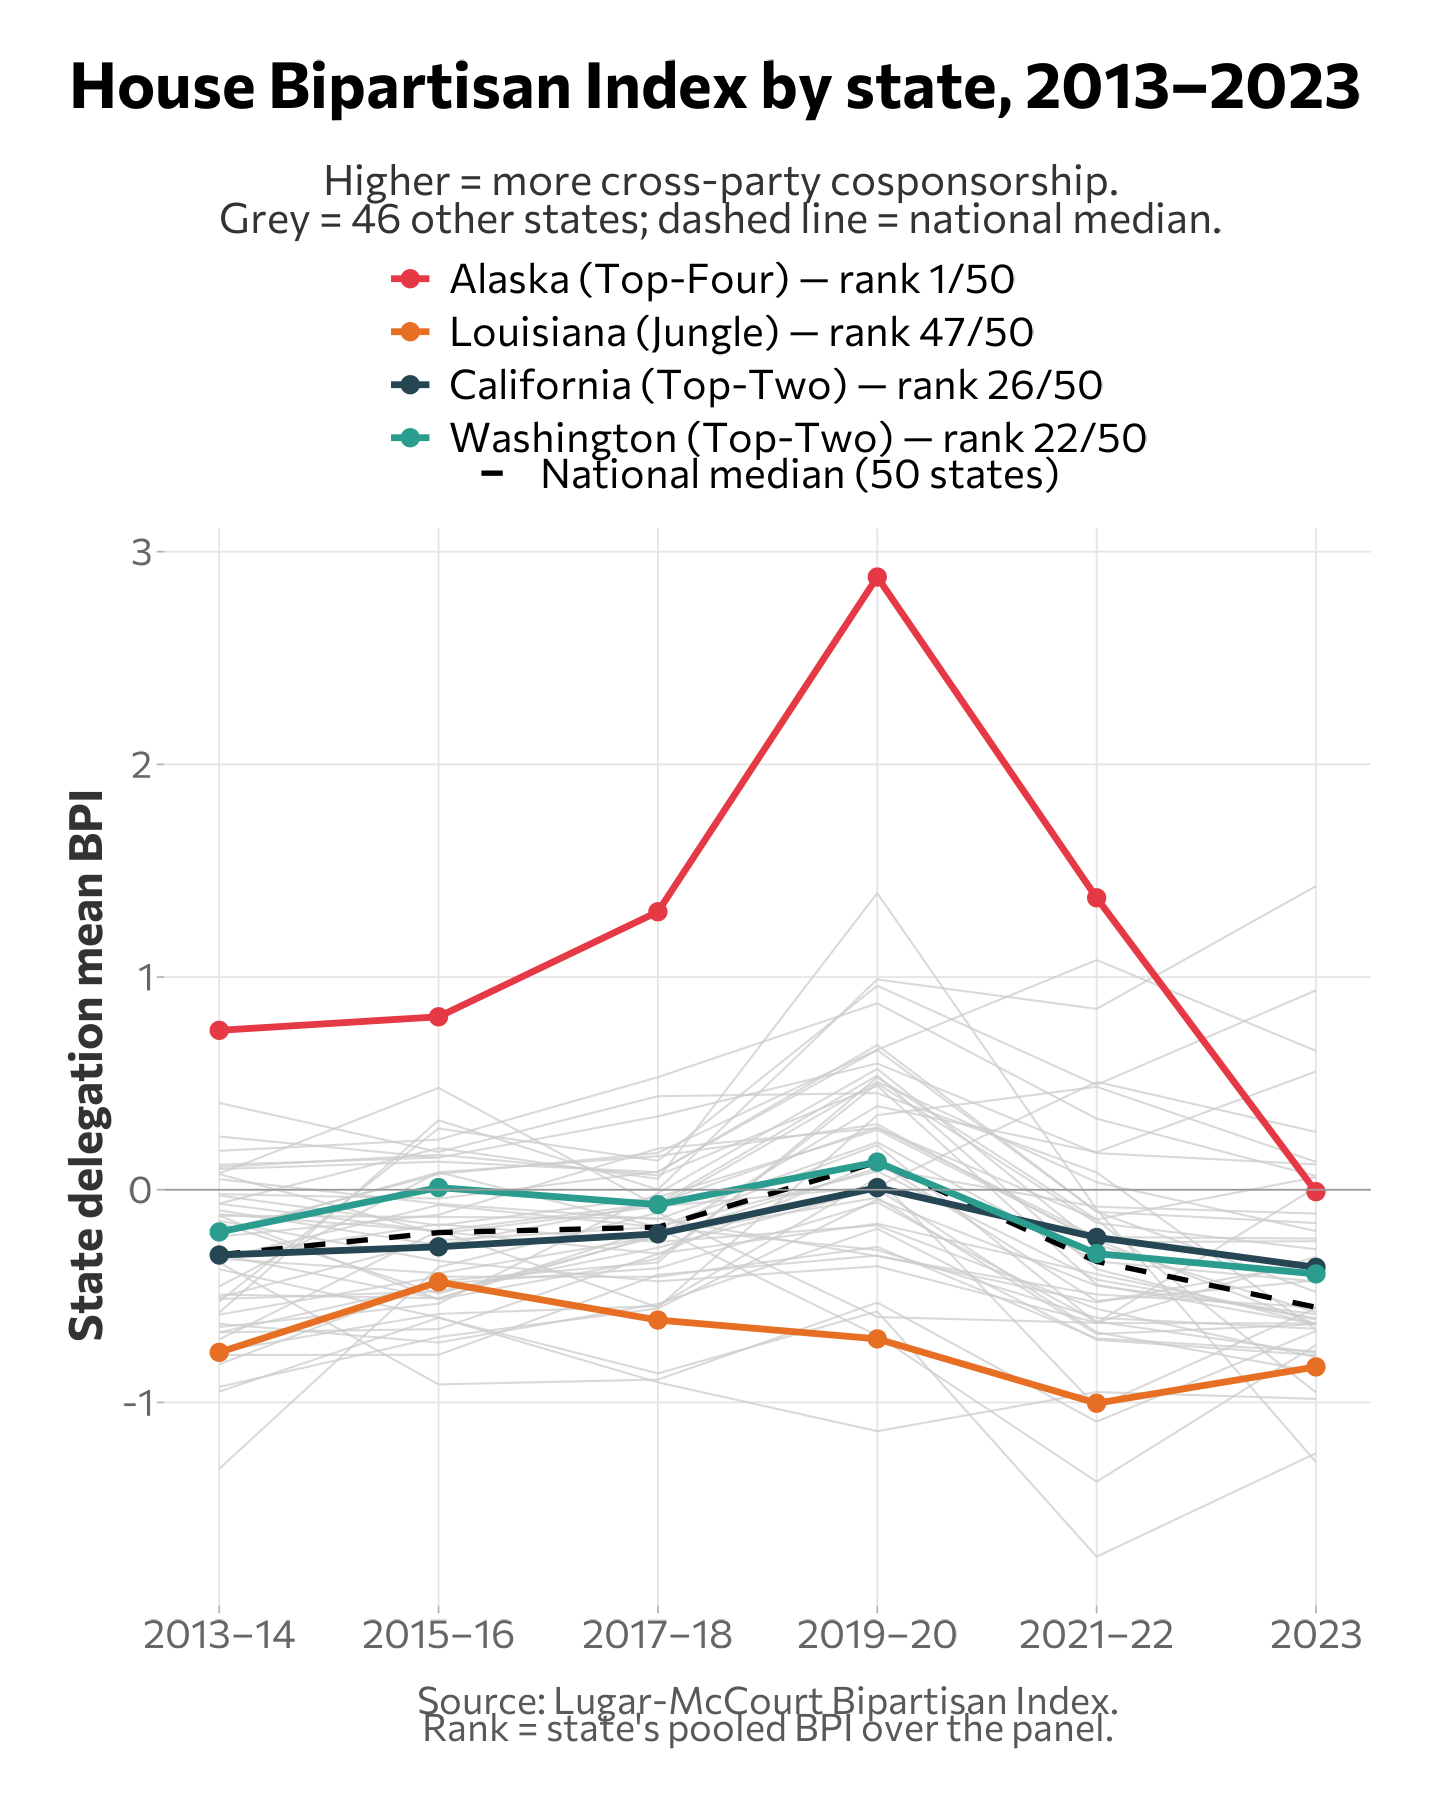
House Bipartisan Index, state delegation means, 2013–2023, ranked out of 50:
| State | Rank | Mean BPI |
|---|---|---|
| Alaska (top-four) | 1 | +1.19 |
| Washington (top-two) | 22 | −0.14 |
| California (top-two) | 26 | −0.23 |
| Louisiana (jungle) | 47 | −0.72 |
Washington and California sit near the middle of the House distribution, essentially at the national median. After more than a decade under top-two, neither state has moved toward the top of the bipartisanship rankings. Louisiana, after fifty years of jungle primaries, has the fourth-lowest House delegation BPI in the country.
Alaska ranks first but has one House seat. Don Young held it from 1973 until 2022 and was an unusually effective cross-party coalition builder well before the top-four reform existed. Mary Peltola, elected under the new system in 2022, scored near the median (−0.01) in her one Congress in the data.
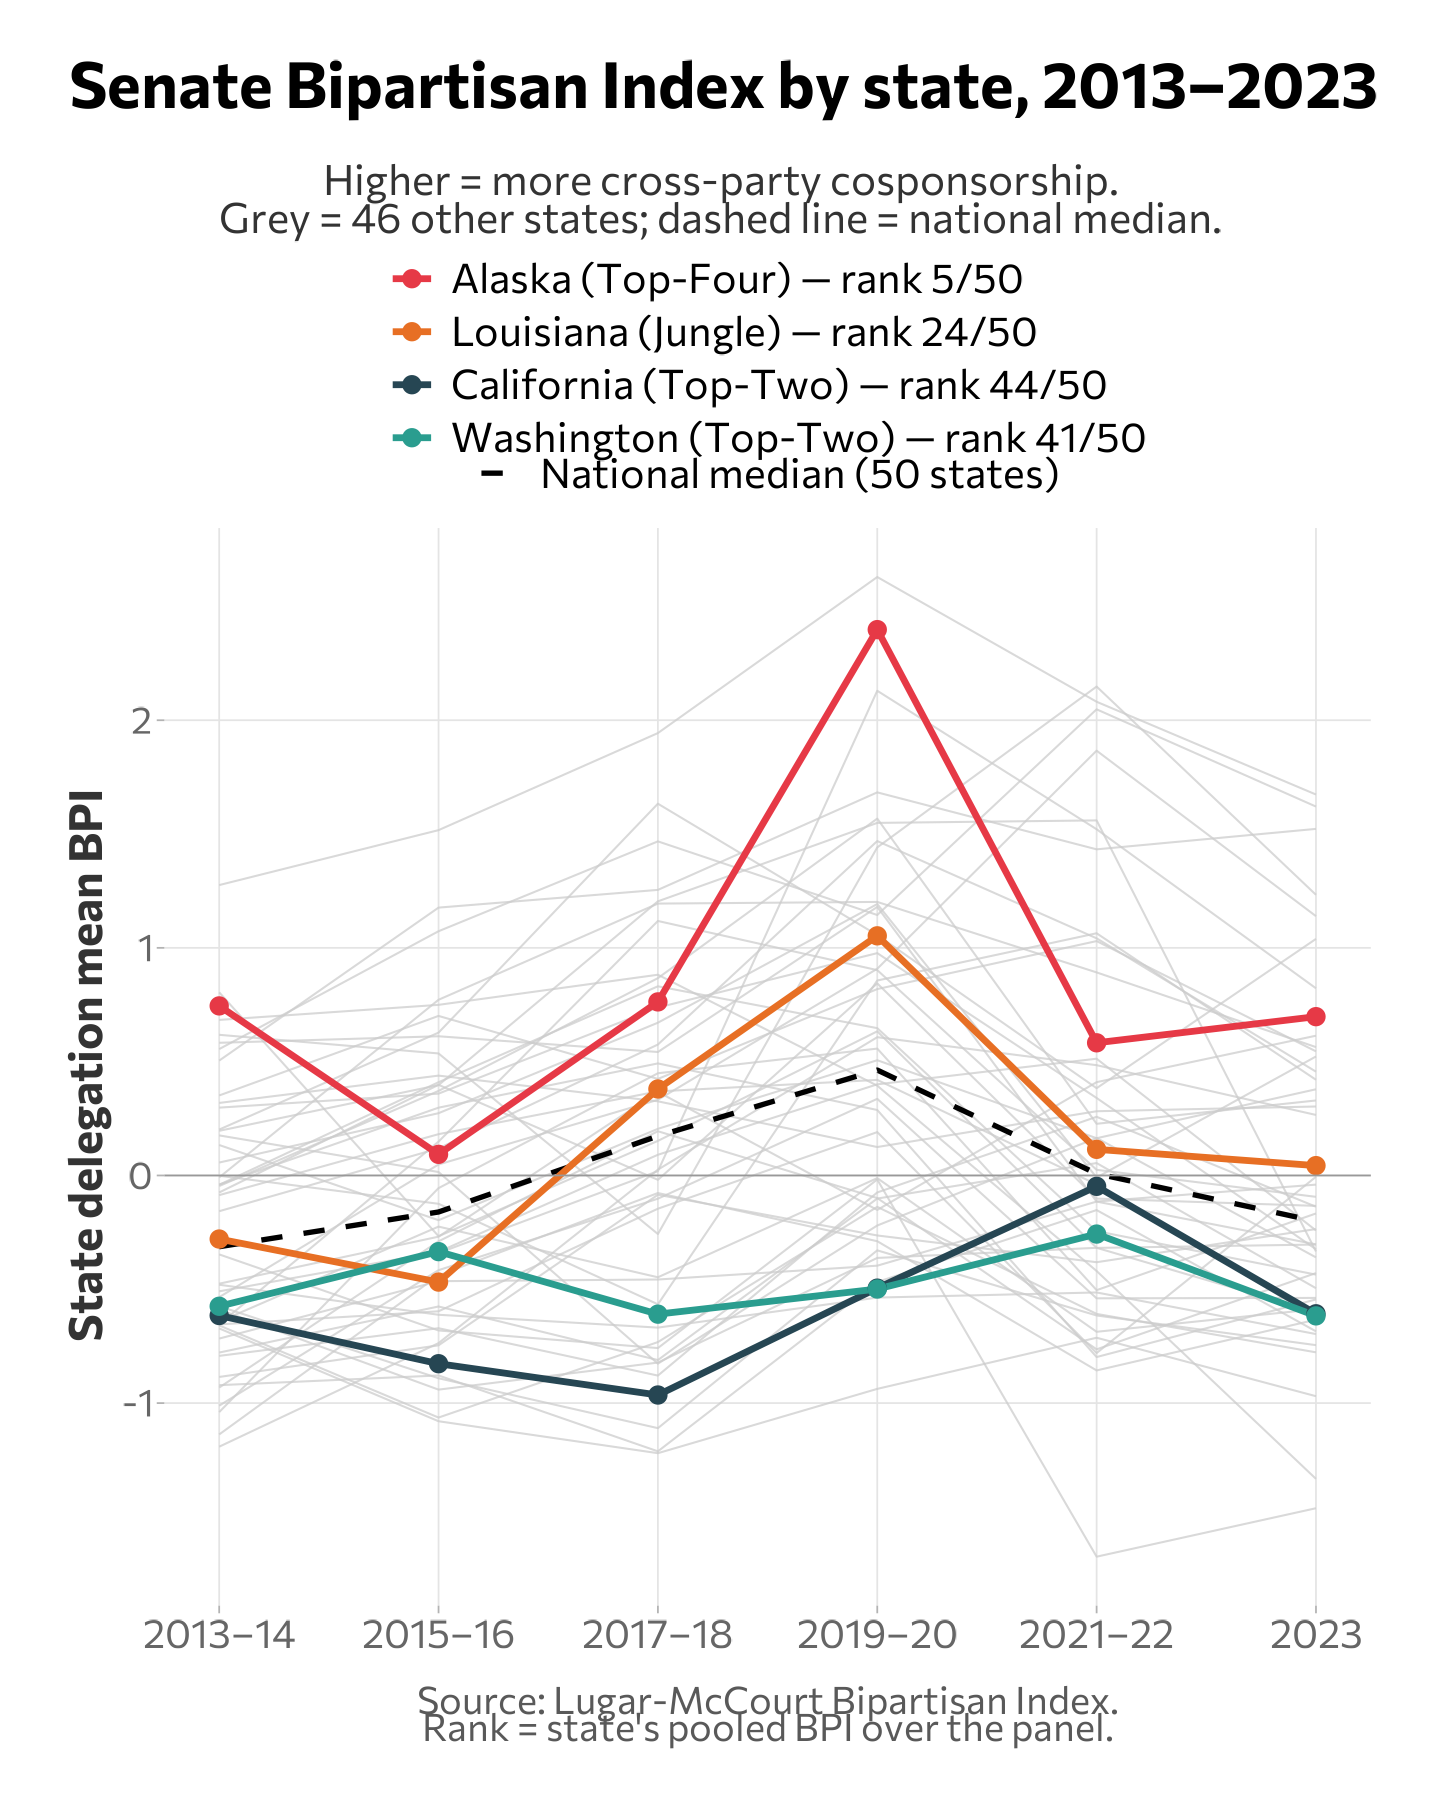
Senate Bipartisan Index, state delegation means, 2013–2023:
| State | Rank | Mean BPI |
|---|---|---|
| Alaska (top-four) | 5 | +0.88 |
| Louisiana (jungle) | 24 | +0.14 |
| Washington (top-two) | 41 | −0.48 |
| California (top-two) | 44 | −0.59 |
The Senate tells a similar story. California and Washington are in the bottom 10 of all 50 states. Louisiana sits near the national median. Only Alaska reaches the top tier.
Alaska’s Senate ranking is not an effect of the 2022 reform. Lisa Murkowski scored +1.43 on the BPI in the 113th Congress, nine years before the ballot measure. She scored +1.54 in the 118th Congress, one year after it took effect. Her bipartisan brand is a pre-existing fact of Alaska politics, not a product of top-four.
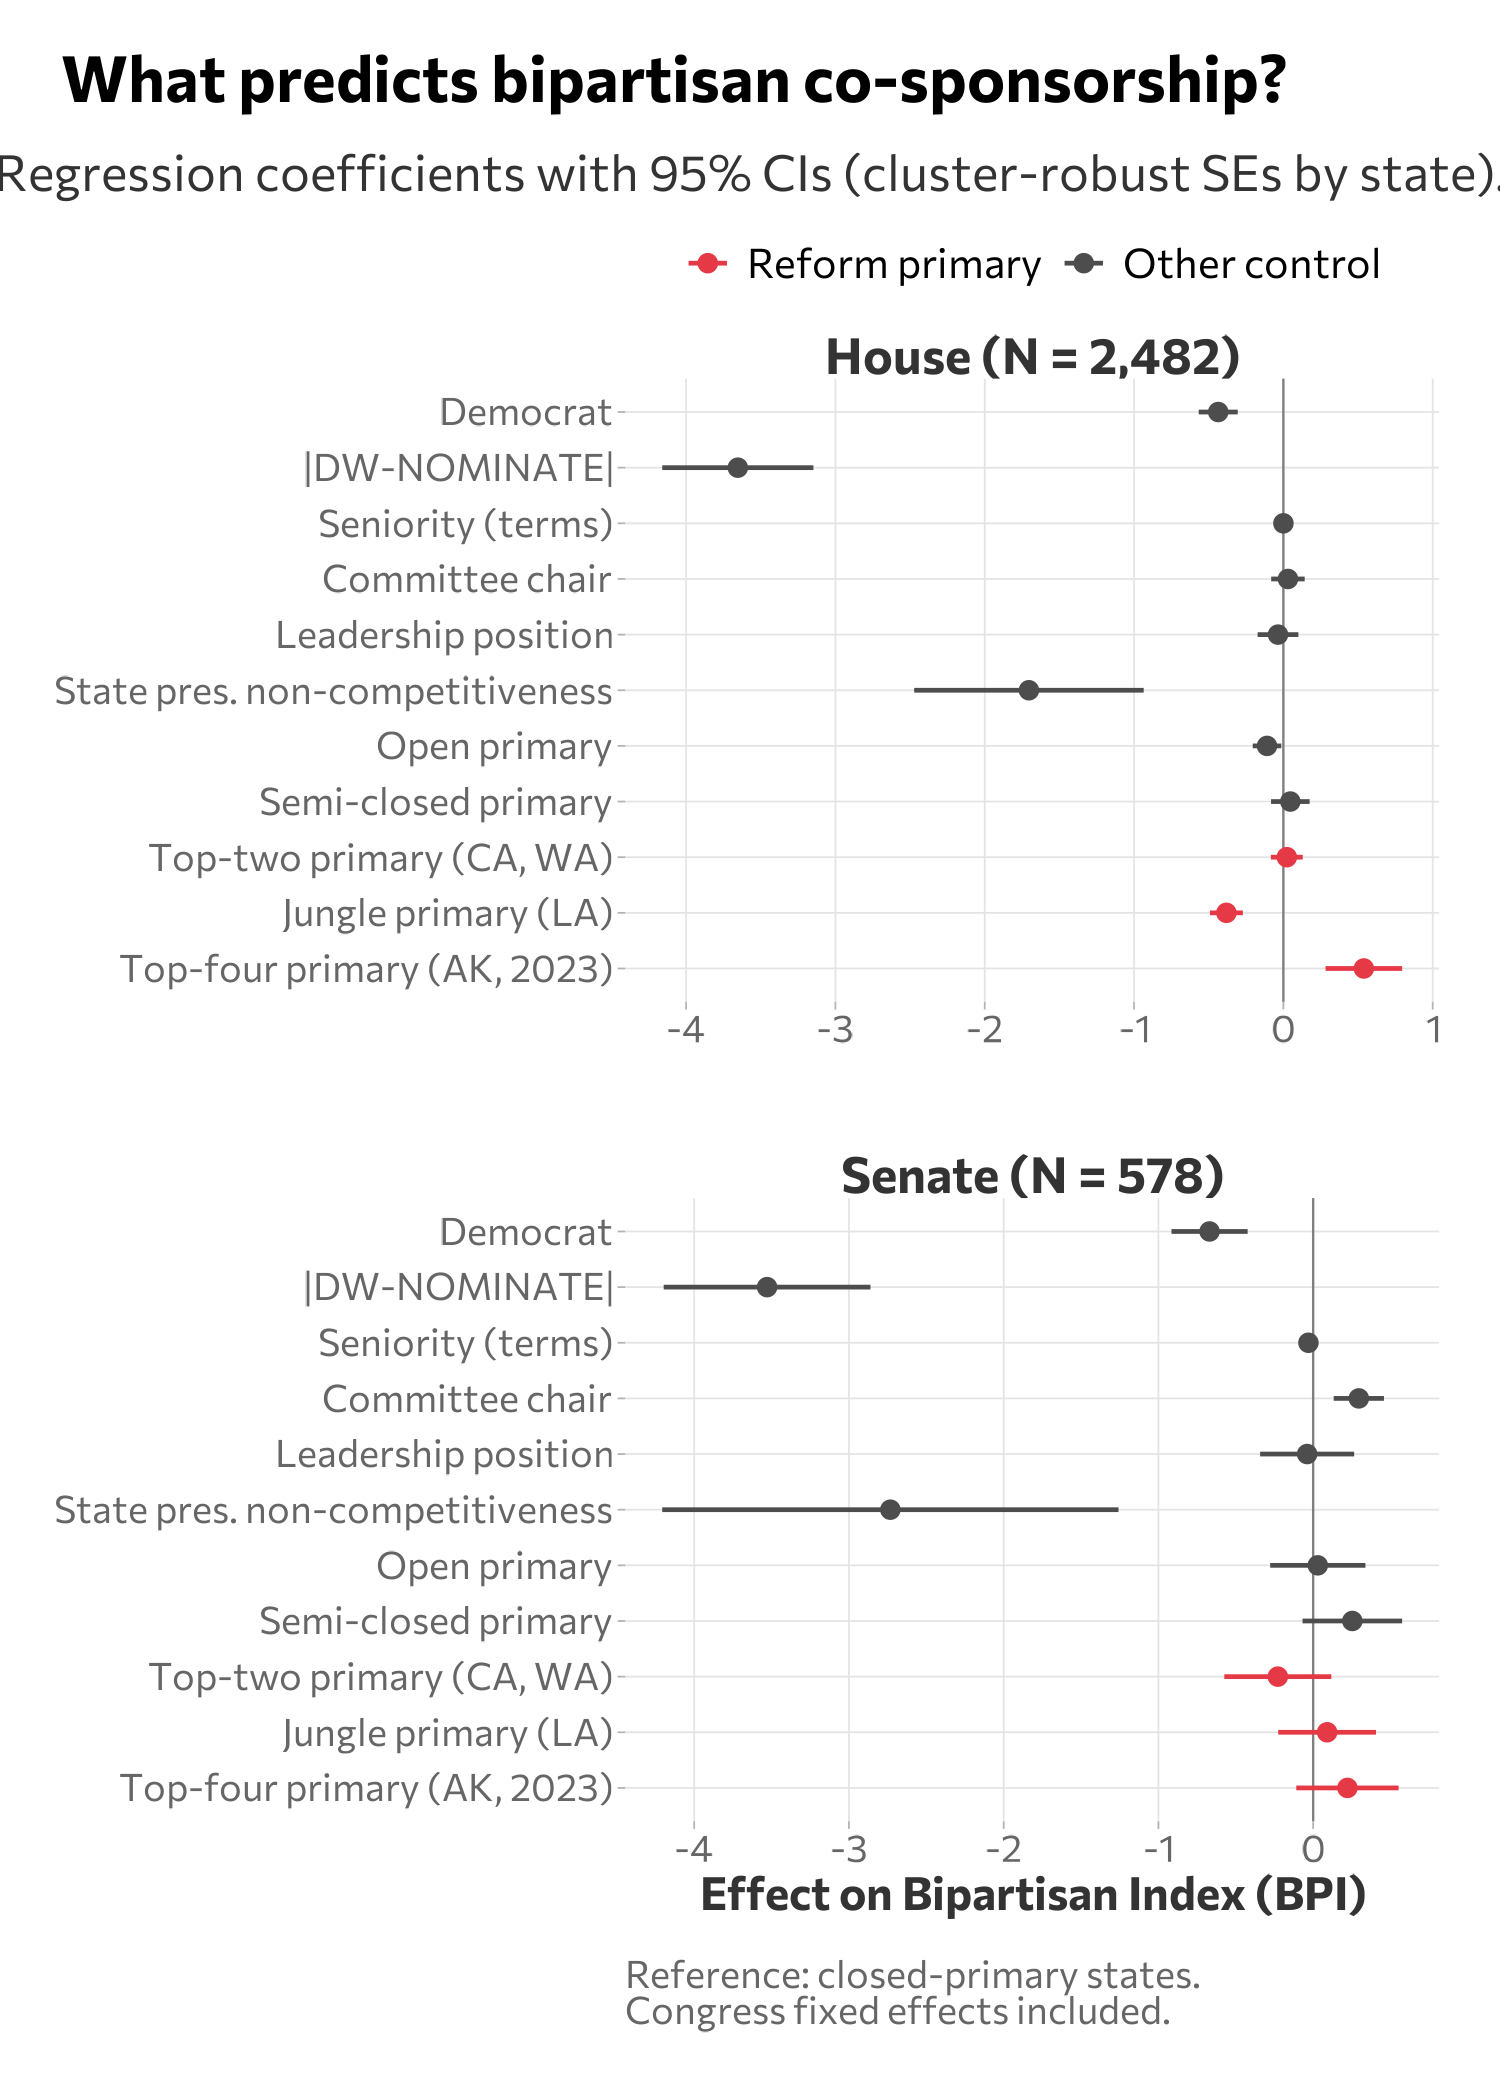
Test 1 — the regression, with full controls
The rankings are unconditional. Reform states may score lower because they are large, diverse, or partisan-unbalanced, rather than because of the primary system itself. To address that, I ran a panel regression on all 2,482 House member-Congress observations and all 578 Senate member-Congress observations, controlling for member ideology (absolute DW-NOMINATE), state presidential-vote competitiveness, member party, seniority, committee chairmanship, leadership roles, and Congress fixed effects. Standard errors are clustered by state.
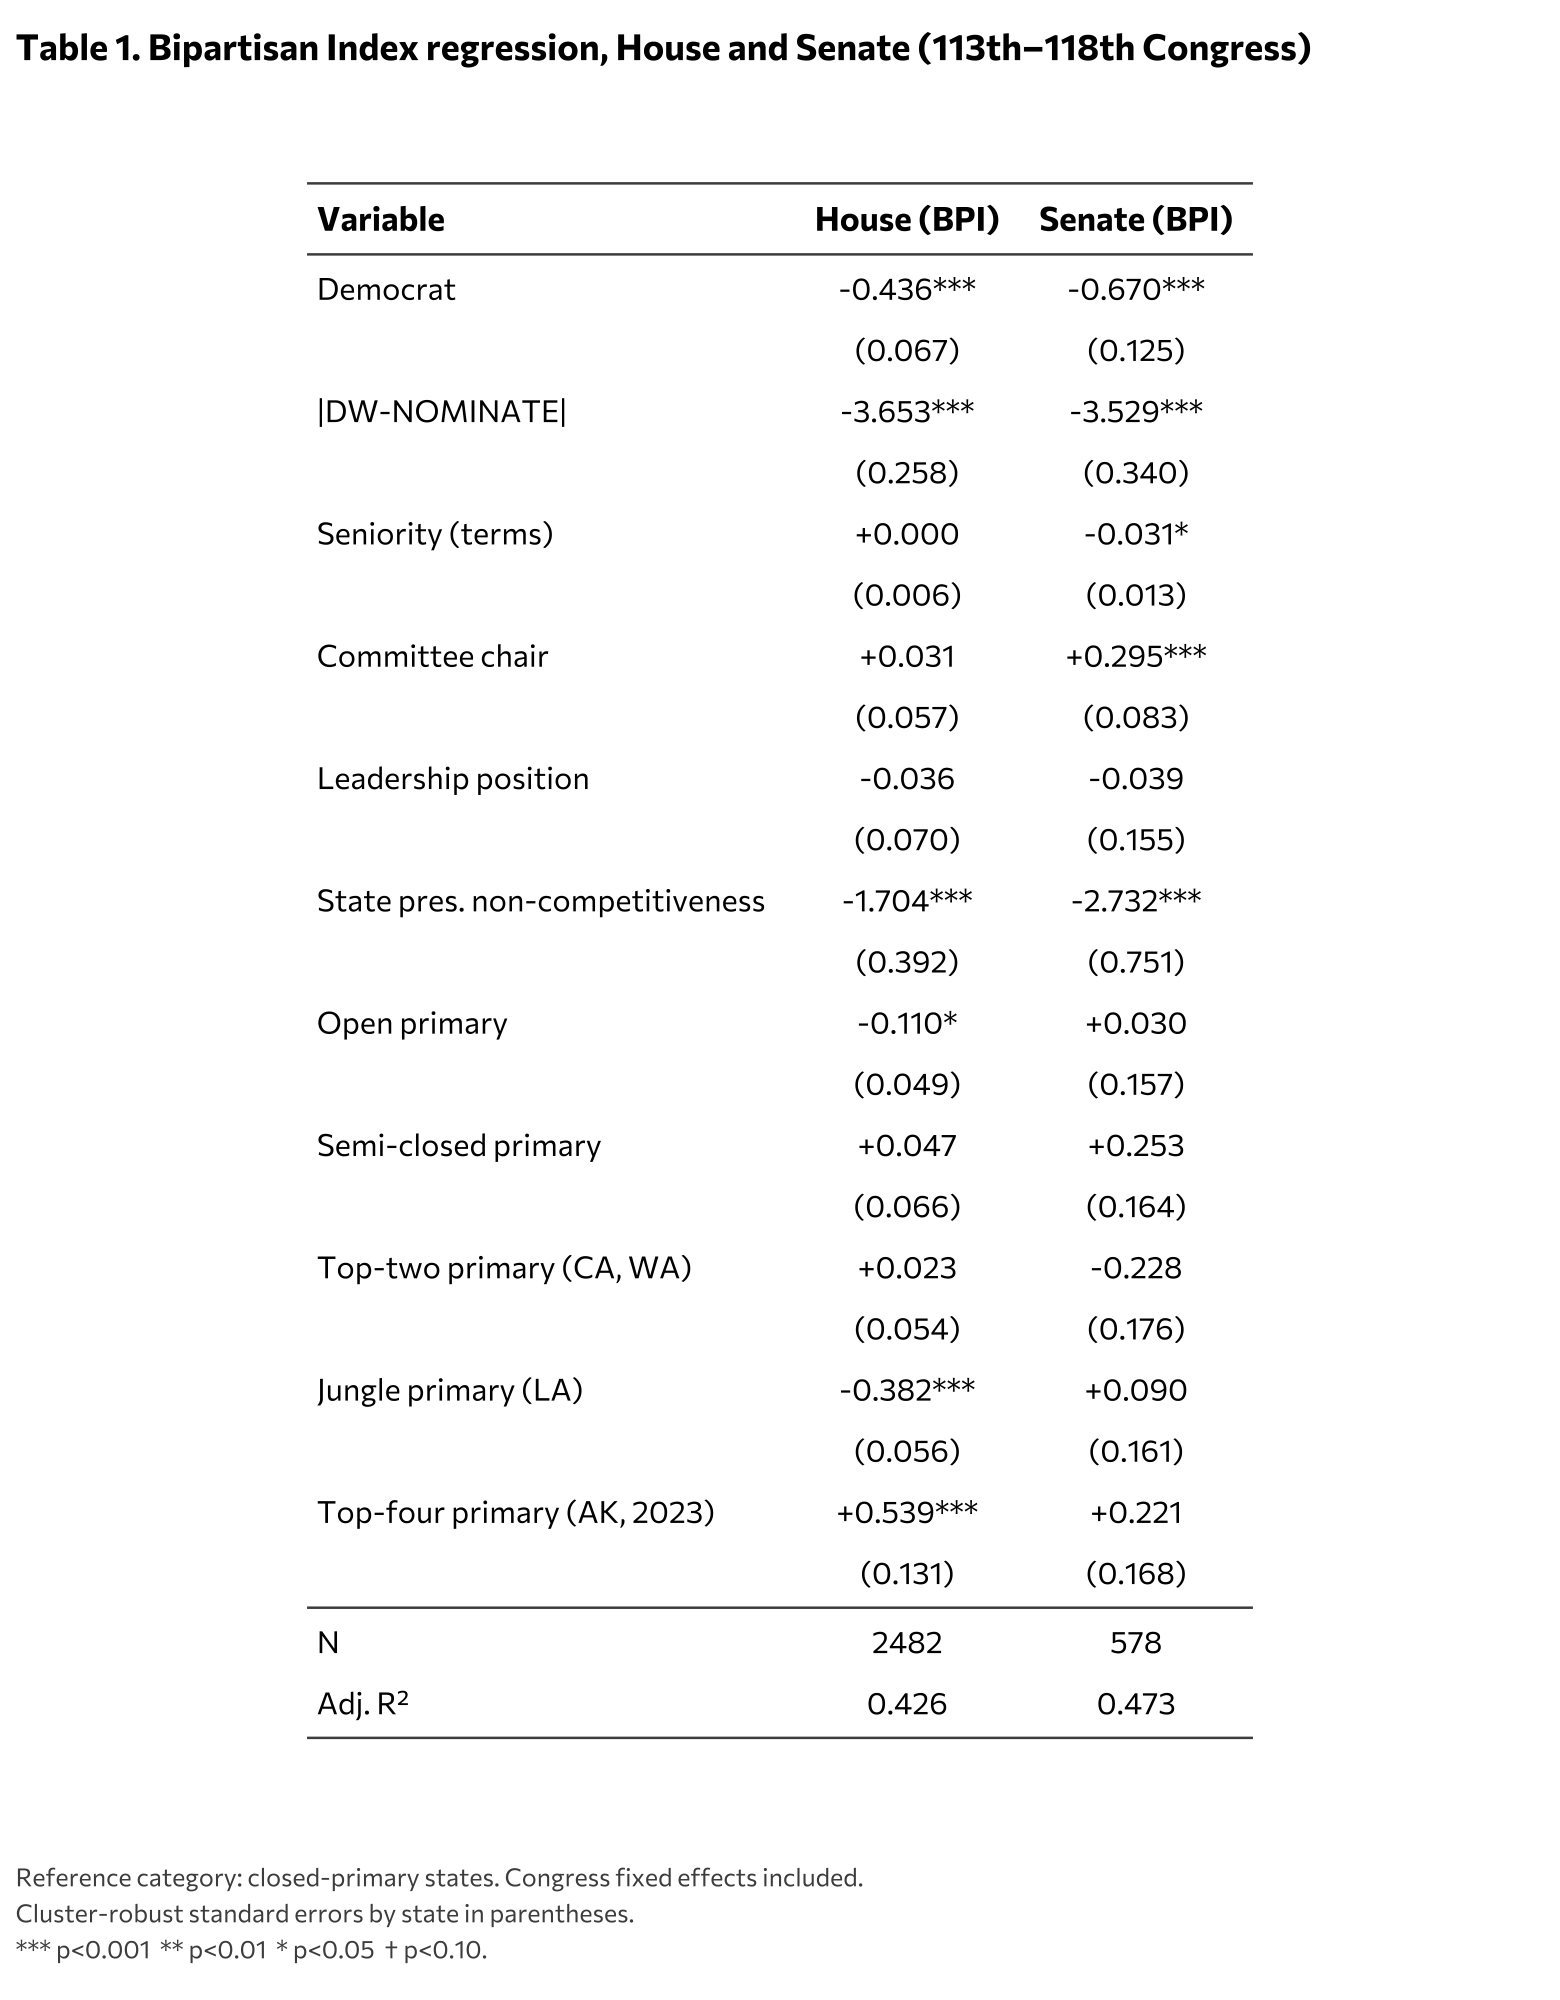
The top-two coefficient is +0.02 in the House and −0.23 in the Senate, neither distinguishable from zero at conventional significance levels. The jungle-primary coefficient is −0.38 (p < 0.001) in the House: Louisiana representatives score about a third of a BPI point lower than closed-primary representatives after controls. The Alaska top-four coefficient is +0.54 (p < 0.001) in the House but rests on one observation (Peltola in the 118th Congress), where DW-NOMINATE predicts a much lower BPI than she received. Read it as a small-sample artifact, not a causal estimate.
Two things do predict bipartisan cosponsorship, across both chambers: ideological moderation and state presidential-vote competitiveness. Their effect sizes dwarf anything the primary-system dummies produce.
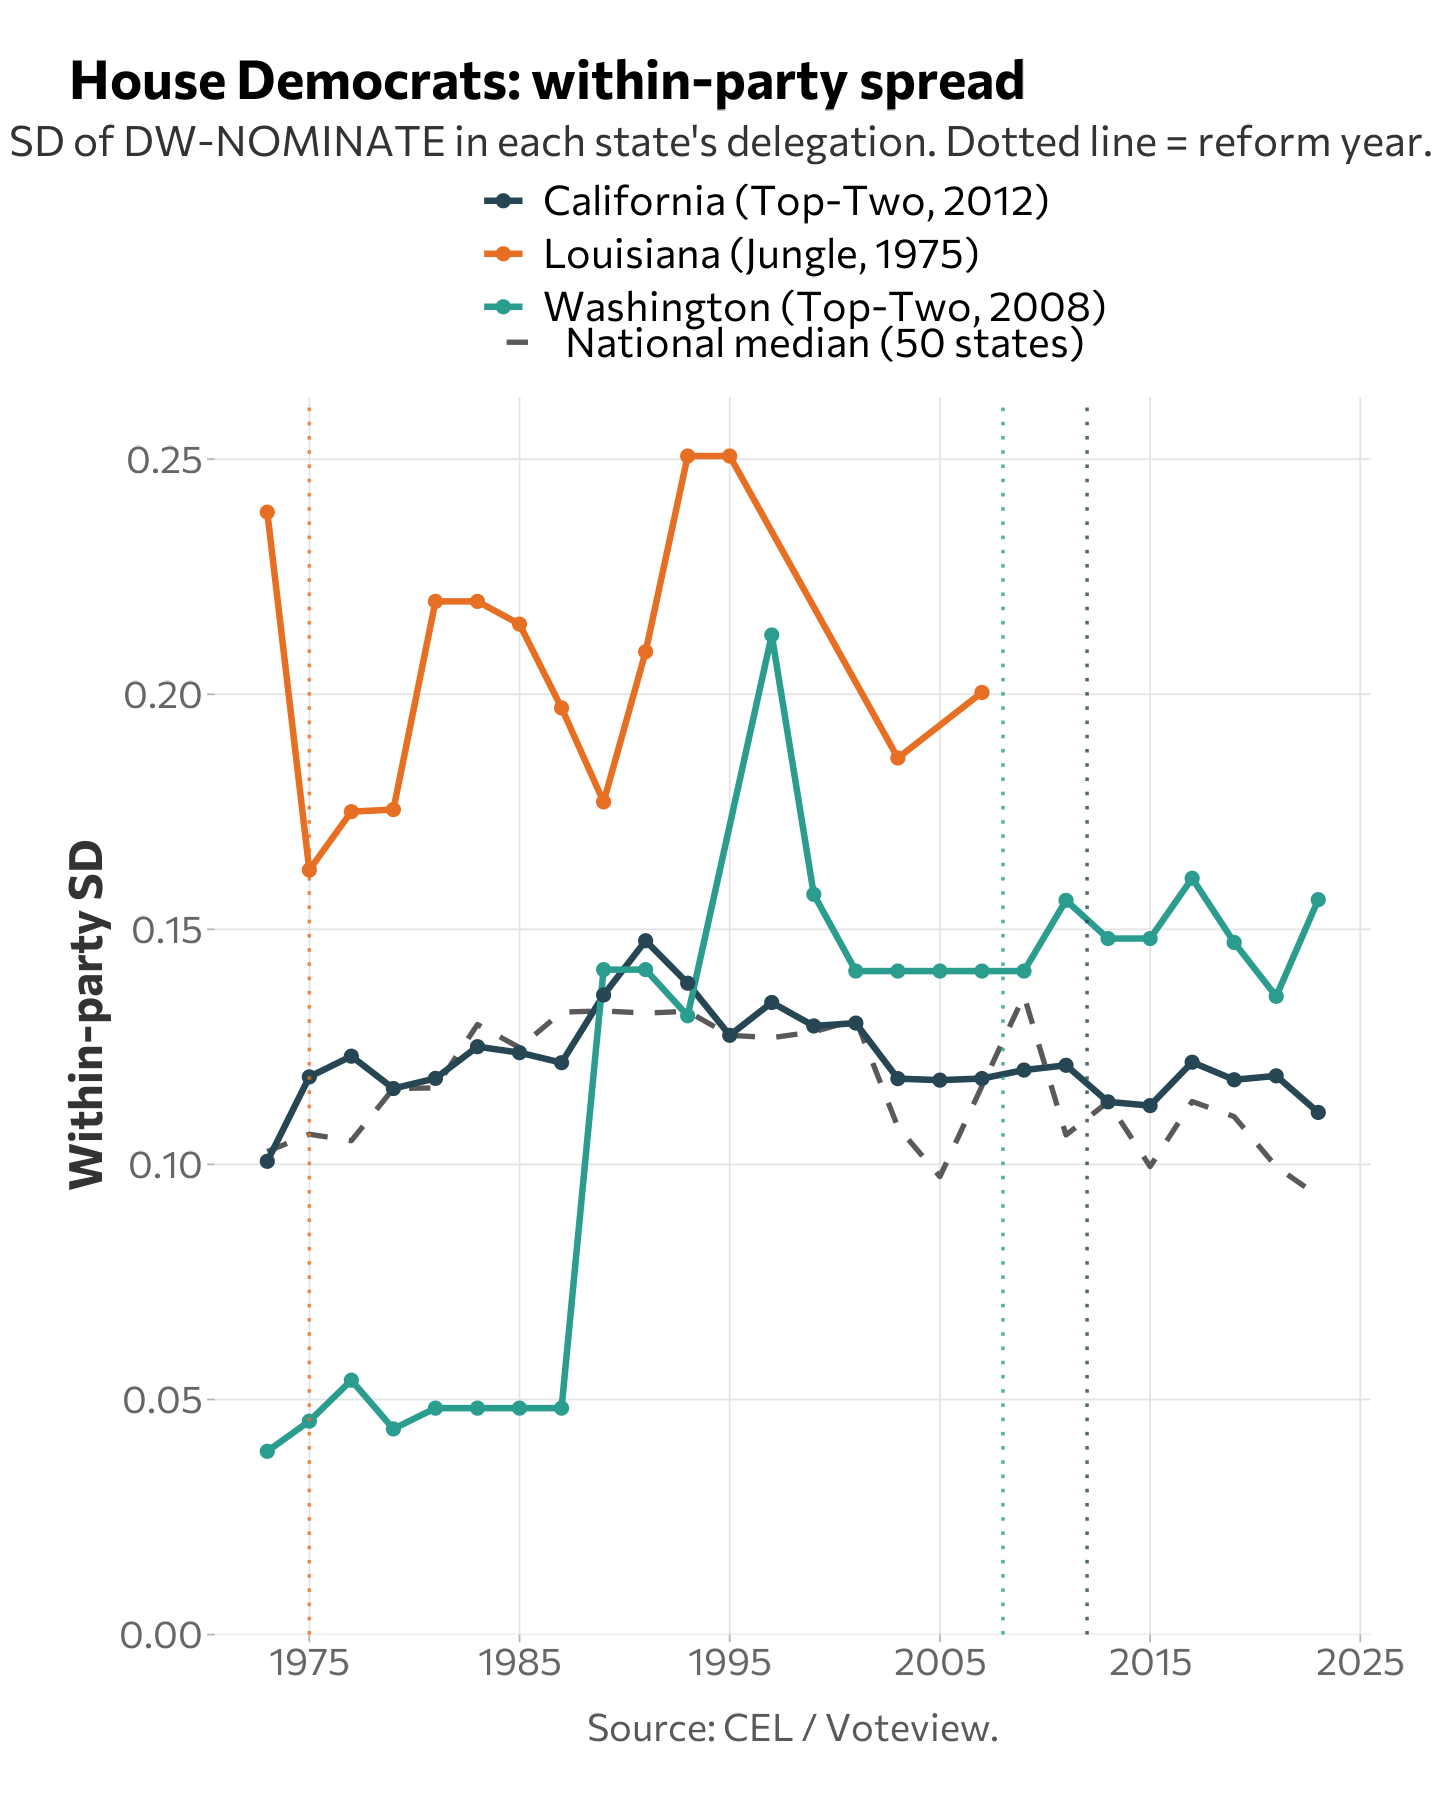
Test 2 — Heterogeneity: did reform-state delegations become more ideologically diverse?
The second version of the reform argument is about within-party spread. Under closed primaries, each party selects a narrower slice of its ideological distribution. Under all-party primaries, both moderate and strongly ideological factions can survive general elections, so the party’s delegation should include a wider range of members. Diverse delegations contain the brokers who do cross-party work.
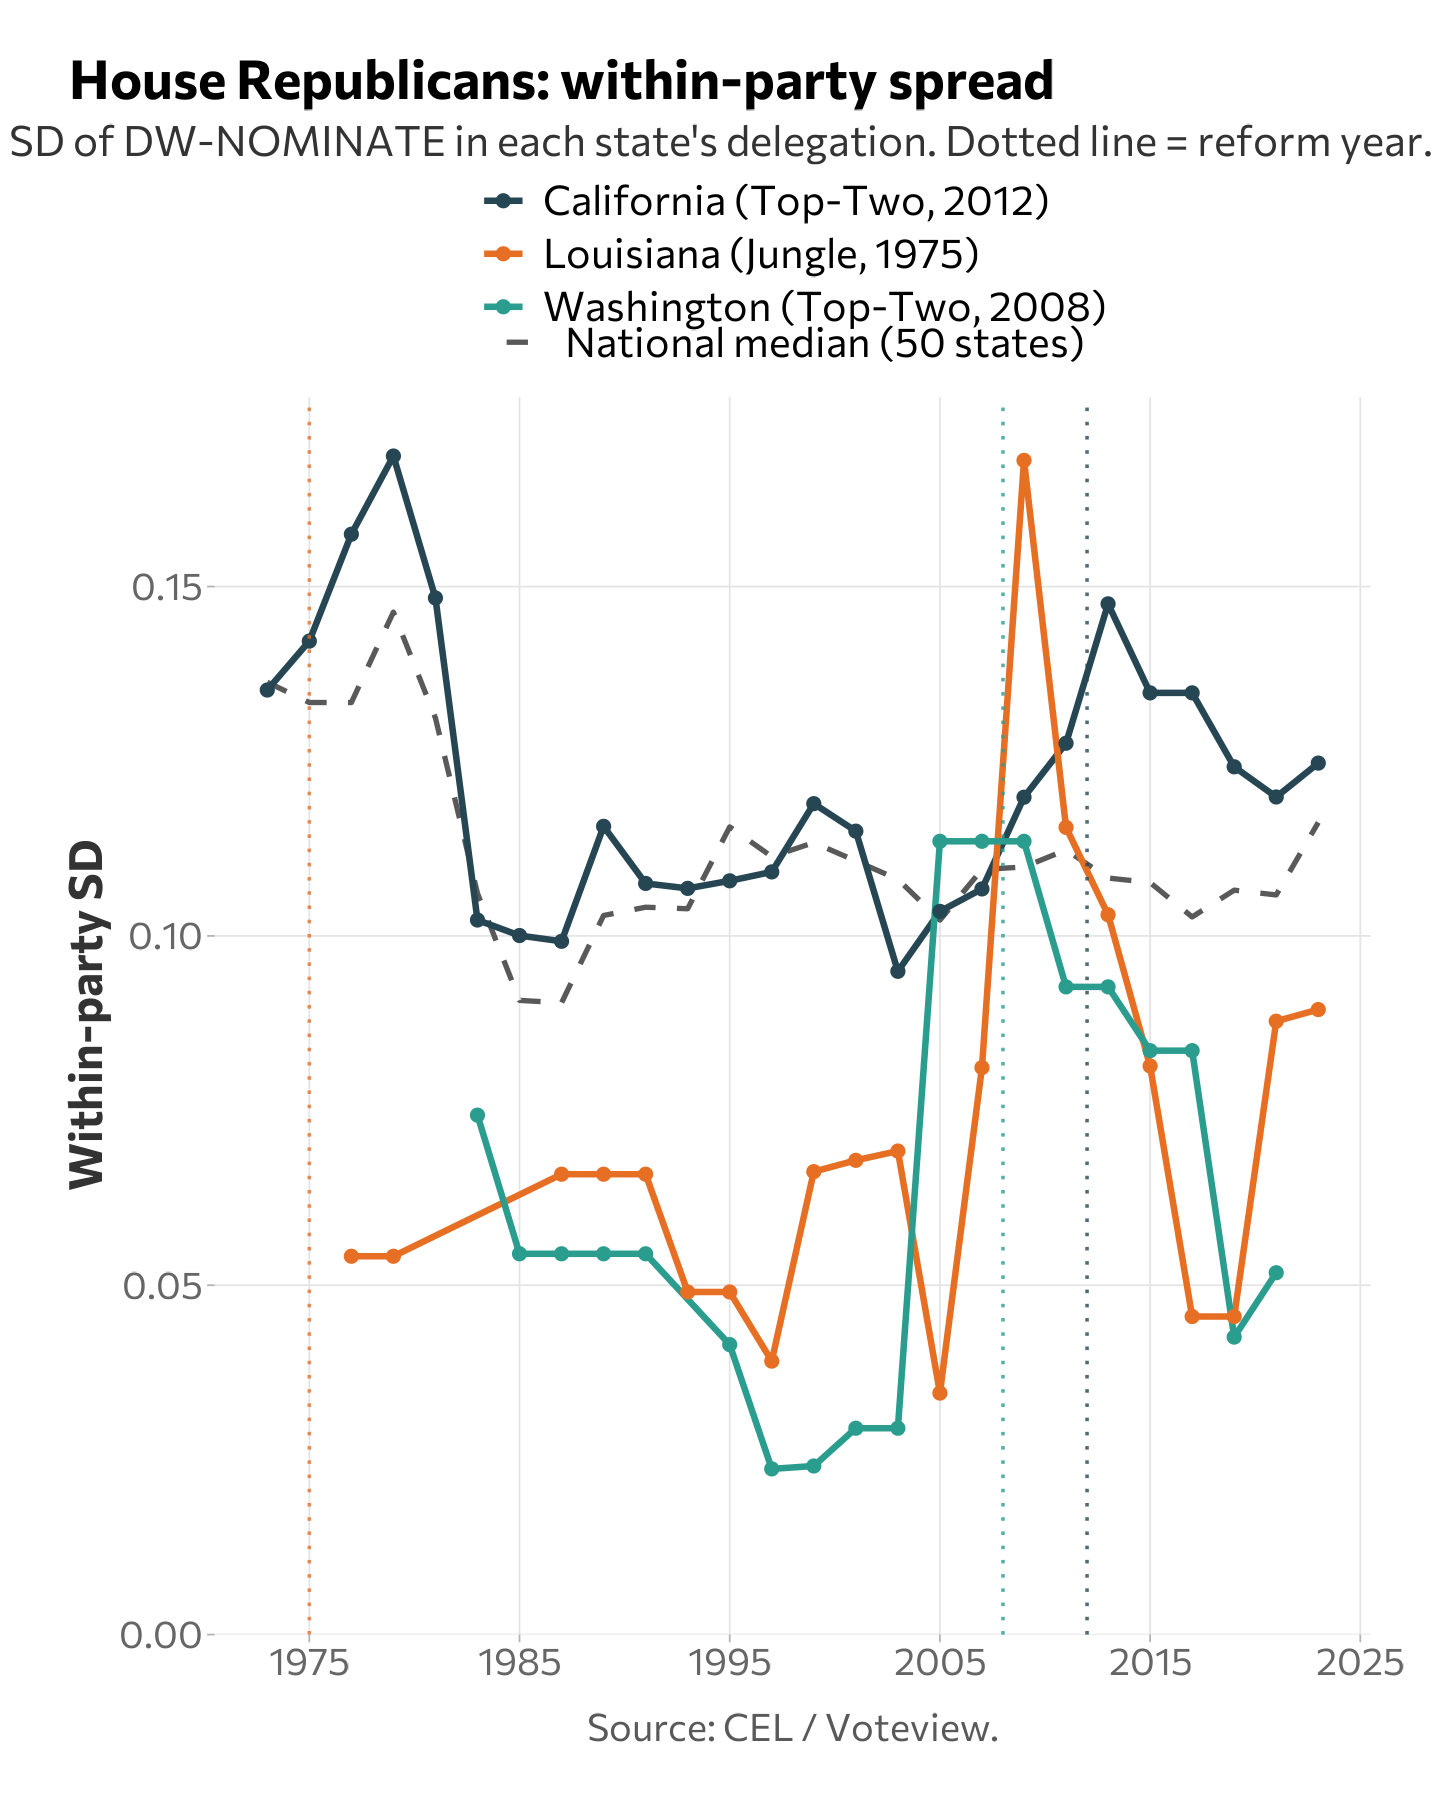
California’s congressional delegation does not bear this out. Using DW-NOMINATE to measure the within-party ideological spread of each state’s House delegation over time:
- California Democrats in Congress. Pre-reform mean SD (1973–2012, 20 Congresses) = 0.124. Post-reform mean (2013–2023, 6 Congresses) = 0.116. The CA Democratic delegation became slightly more homogeneous after top-two (Δ = −0.008, p = 0.007).
- California Republicans in Congress. Pre-reform SD = 0.119. Post-reform = 0.131. A small increase (Δ = +0.012, p = 0.08) that borders significance.
California was not unusually heterogeneous before the reform. In the pre-reform era (1993–2012), California ranked 18th of 34 states on Democratic within-party spread and 18th of 35 on Republican spread. Middle of the distribution.
Washington is the one state where the pattern fits the reform story. Its Democratic delegation SD went from 0.101 (pre-2008) to 0.149 (post-2008), p = 0.003. Its Republicans moved a smaller amount in the same direction (0.056 to 0.080, p = 0.08).
State size and one-party dominance matter more than reform
The small effects on delegation heterogeneity may reflect primary reform. Or they may reflect state size (large, diverse states naturally produce more varied delegations) and partisan competitiveness (balanced states put both moderates and ideologues in each party). To distinguish these, I ran a panel regression across all state-Congress-party observations from 1993 to 2023, restricted to cases with at least three members of the target party per state-Congress.
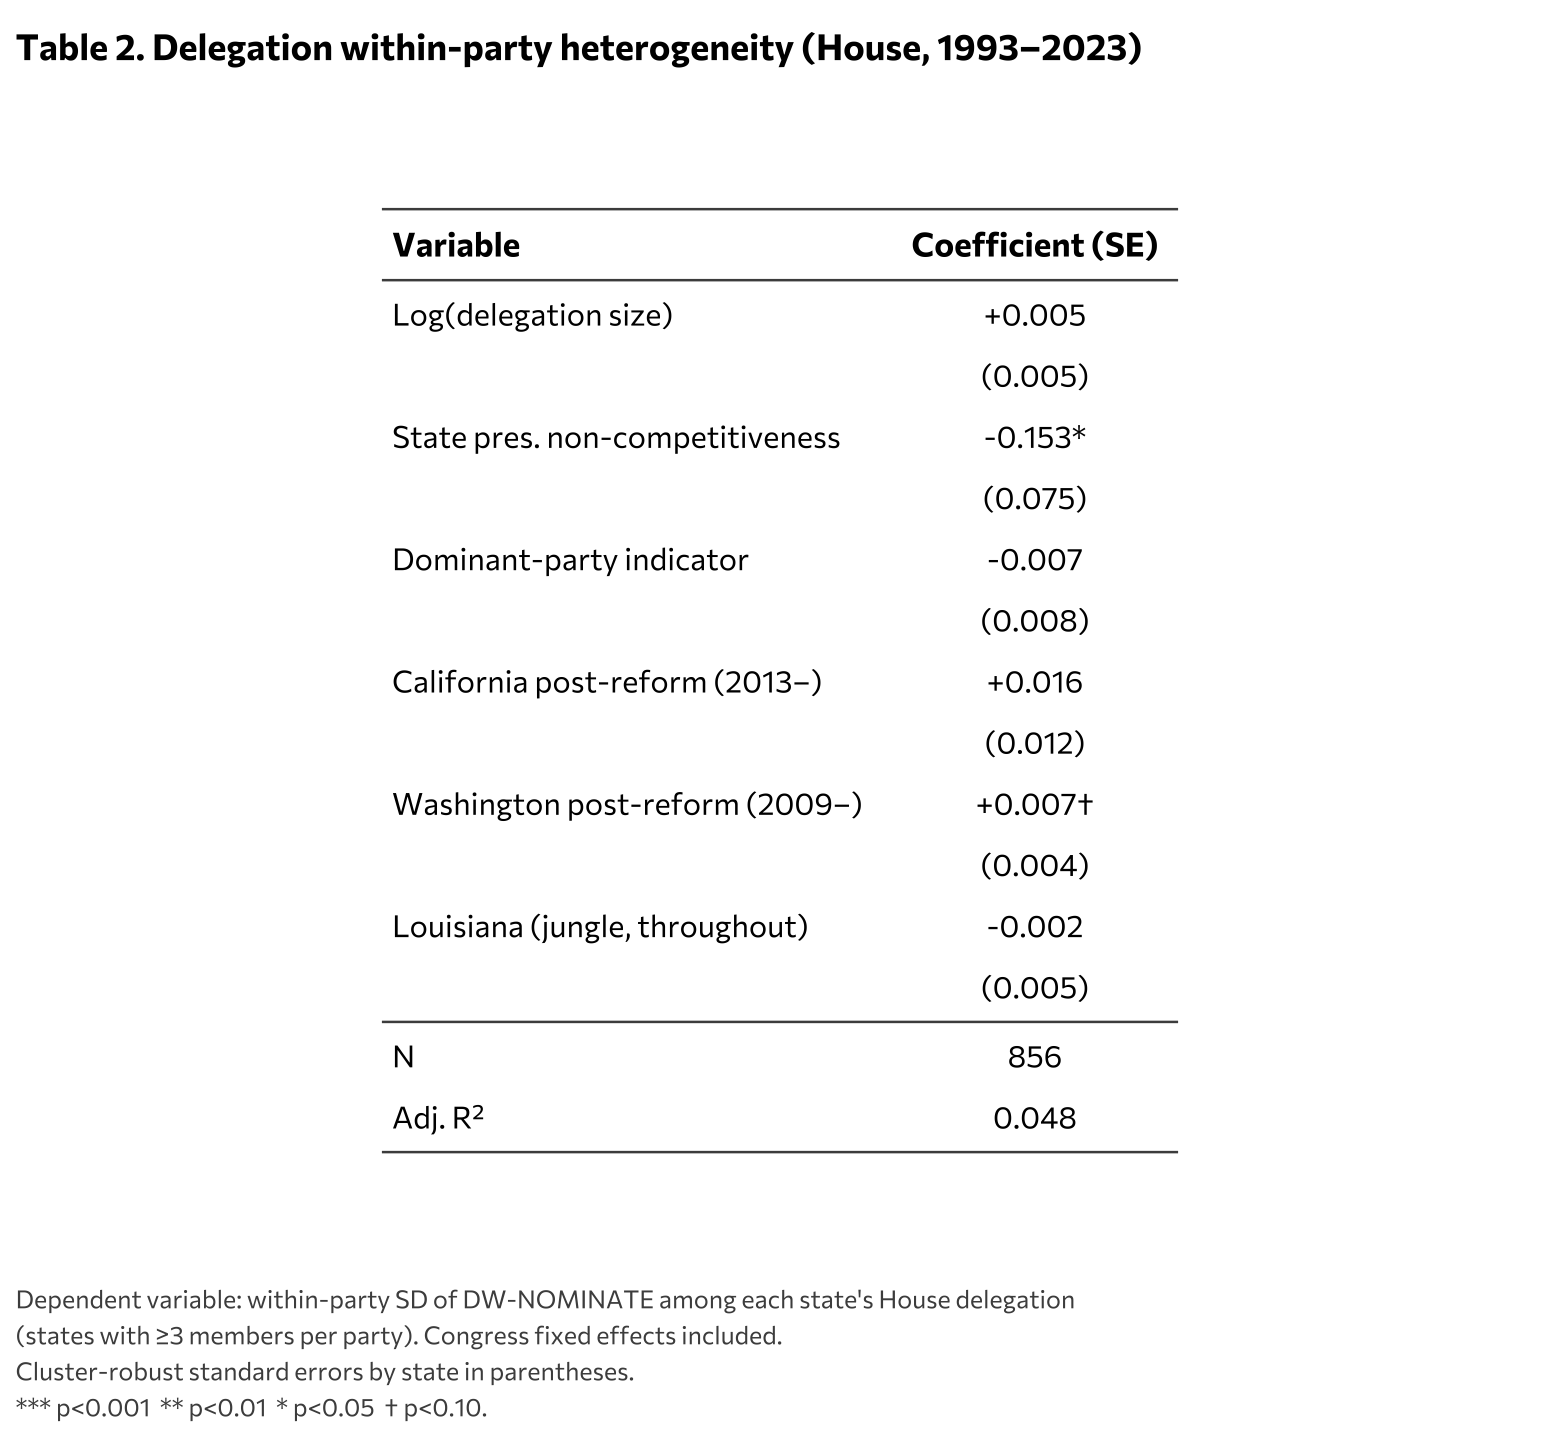
State partisan competitiveness is the dominant structural predictor of delegation heterogeneity. More one-party-dominant states have less heterogeneous delegations. In non-competitive states, the minority party shrinks to its ideological core, and the dominant party still selects candidates near its own median. State size has a small positive coefficient that isn’t significant after controls. Conditional on all of this, reform dummies add essentially nothing detectable.
Splitting the sample by party produces two significant coefficients: WA Democrats +0.051 (p < 0.001) and LA Democrats +0.105 (p < 0.001). These are Washington- and Louisiana-specific findings, not a clean reform effect. CA Democrats’ post-reform coefficient is +0.026 (p = 0.13) even with national time trends absorbed by Congress fixed effects. That does not survive as evidence for the heterogeneity claim at the congressional level.
A note on California’s state legislature
The Shor-McCarty state-legislator ideology data does show a real heterogeneity increase in Sacramento post-2011. California’s state legislature Democratic caucus now includes a durable moderate bloc that did not exist under closed primaries. That spectrum-widening has not propagated to the state’s congressional delegation, as shown above. It is also worth examining more carefully.
Three points of caution on attributing the Sacramento shift to top-two specifically:
First, top-two was not the only reform that took effect in California around 2011. The state’s Citizens Redistricting Commission, established by Proposition 11 in 2008 and expanded by Proposition 20 in 2010, drew its first set of state legislative and congressional maps for the 2012 cycle, the same cycle in which top-two first applied. Independent redistricting produced more competitive state legislative districts than the previous legislature-drawn maps had. The within-party SD increase observed after 2011 could reflect top-two, independent redistricting, or (most likely) some combination of the two. With both treatments applied simultaneously to the same state in the same year, the data cannot cleanly separate them. My state-level regression above shows that partisan competitiveness is the dominant structural predictor of delegation heterogeneity, which suggests redistricting may be doing much of the work.
Second, the magnitude is modest. California’s state House Democratic within-party SD rose from roughly 0.40 before 2011 to roughly 0.52 after. That is a real shift of about 30 percent on the SD scale, but it is not a transformation. Most of the CA Democratic caucus continues to cluster near the party median.
Third, California remains one of the most between-party-polarized state legislatures in the country. Even after the within-party SD increase, the gap between California’s Democratic and Republican medians in the state House is around 3.0 on the Shor-McCarty scale, top-tier nationally. Whatever top-two and redistricting did at the edges of each caucus, they did not narrow the ideological distance between the two parties. The parties became internally wider and stayed just as far apart.
California’s state legislature is a plausible partial vindication of the reform argument, with a real caveat about simultaneous institutional changes and a size of effect that is meaningful but not dramatic. None of it has moved the state’s congressional delegation.
Bottom line
Bipartisan congressional behavior is driven by two things: individual ideological moderation and the competitiveness of the seat. The highest-BPI House members in the panel (Brian Fitzpatrick of Pennsylvania, Marc Molinaro of New York, Chris Pappas of New Hampshire, Jared Golden of Maine, Don Bacon of Nebraska) all represent competitive swing districts in states with closed, semi-closed, or open primaries. The common thread is the general election they face, not the primary that got them to it.
Reform may change the composition of state legislatures at the edges, especially where it coincides with redistricting reform. It has not changed the voting and cosponsorship behavior of California’s, Washington’s, Louisiana’s, or Alaska’s congressional delegations in any way that shows up in the data.
Notes
Data sources: Lugar-McCourt Bipartisan Index (Congresses 113–118); Center for Effective Lawmaking dataset for DW-NOMINATE and member controls (Congresses 93–118); Shor-McCarty state legislator aggregate ideology data (Harvard Dataverse, April 2023 release, covering 1993–2020). Primary-system classifications are from Ballotpedia and NCSL.
Caveats: Alaska’s top-four reform had applied for only one Congress (the 118th) at the time of analysis, giving one House member and two senators’ worth of post-reform observations. Louisiana’s jungle primary dates to 1975; its effect is inseparable from five decades of Louisiana political culture. California and Washington adopted top-two in 2010 and 2008 respectively, so the Bipartisan Index (which starts in 2013) observes only post-reform data for those states and cannot run a before-and-after comparison at the congressional level. California’s independent redistricting commission also produced its first maps for the 2012 cycle, making it difficult to separate the effect of top-two from the effect of more competitive state legislative districts. The Shor-McCarty state-legislature data ends in 2020 and cannot evaluate Alaska’s reform. I tested federal expenditures per capita as an alternative explanation for Alaska’s apparent bipartisanship and rejected it (state-level Senate BPI correlation r = 0.03).